A record summer, less money in the bank
Two-truck HVAC company, Connecticut, September 2026.
Worth $29,323 a year, and $16,837 of cash now.
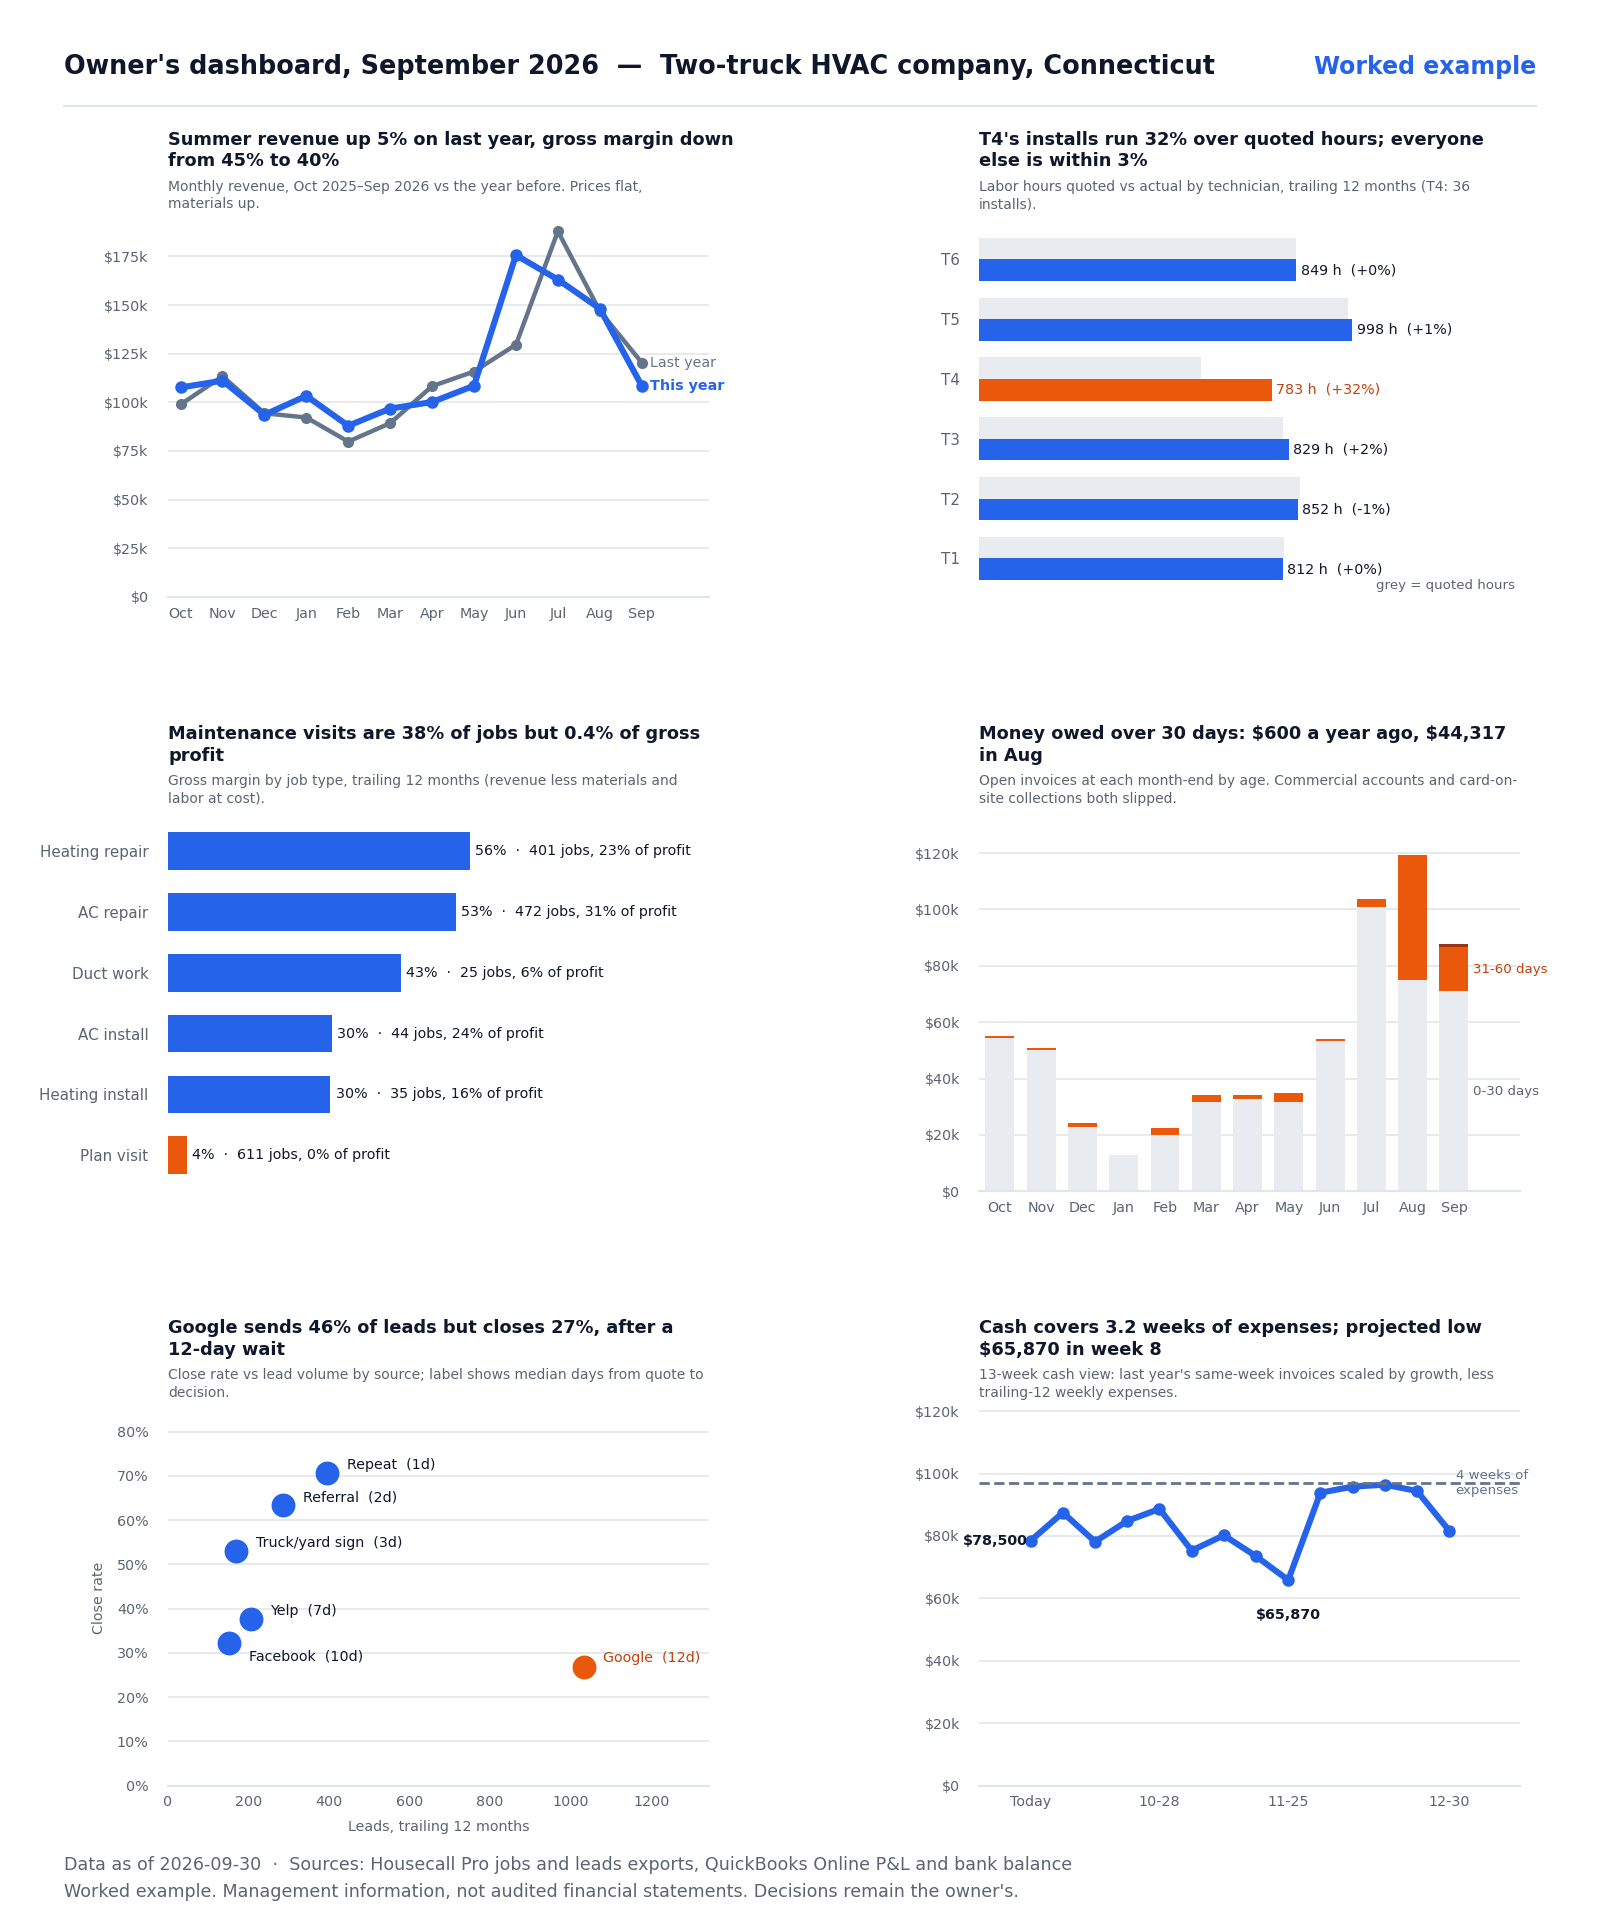
What it was worth
$29,323 a year, found in a two-truck HVAC company doing $1.4M.
$21,385
a year at current visit volume
Reprice the maintenance plan from $114 to $149 a visit.
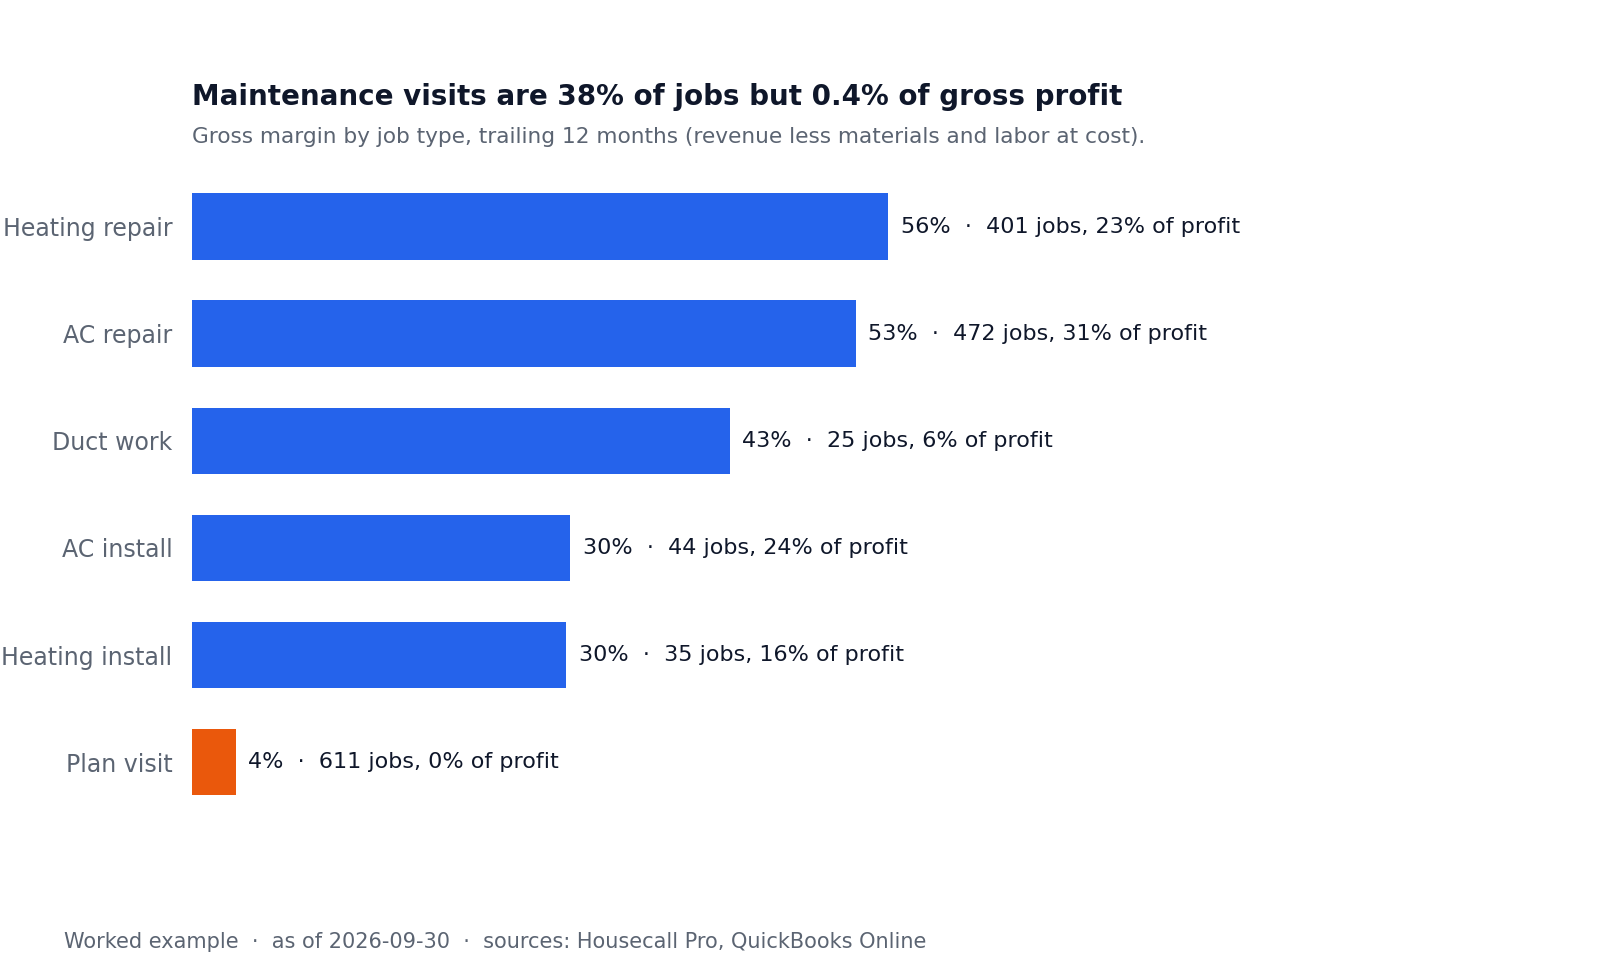
611 plan visits this year earned $2,403 of gross profit, $4 each. Members still bring 49.6% of repair profit.
$7,938
a year in labor cost
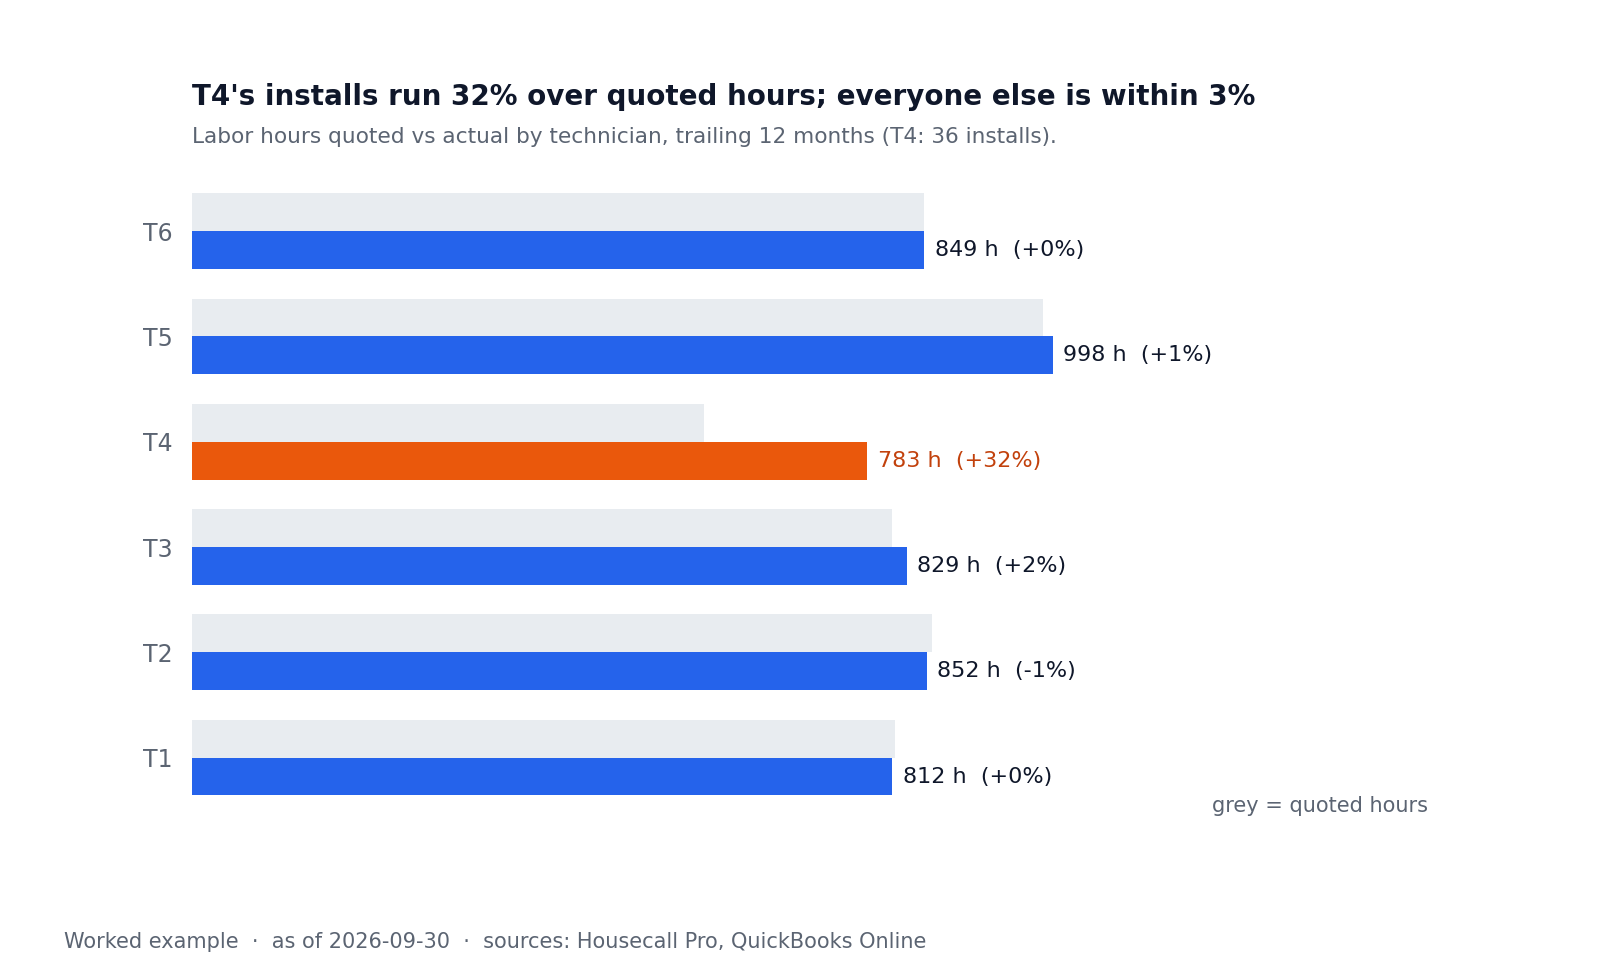
Walk one technician’s install quotes against the clock, job by job.
T4’s 36 installs took 783 hours against 594 quoted, 189 over at $42 an hour. The other five technicians are within 3%.
$16,837
of cash in the next 30 days
Call every invoice over 30 days this week; commercial accounts move to a deposit plus net-15.
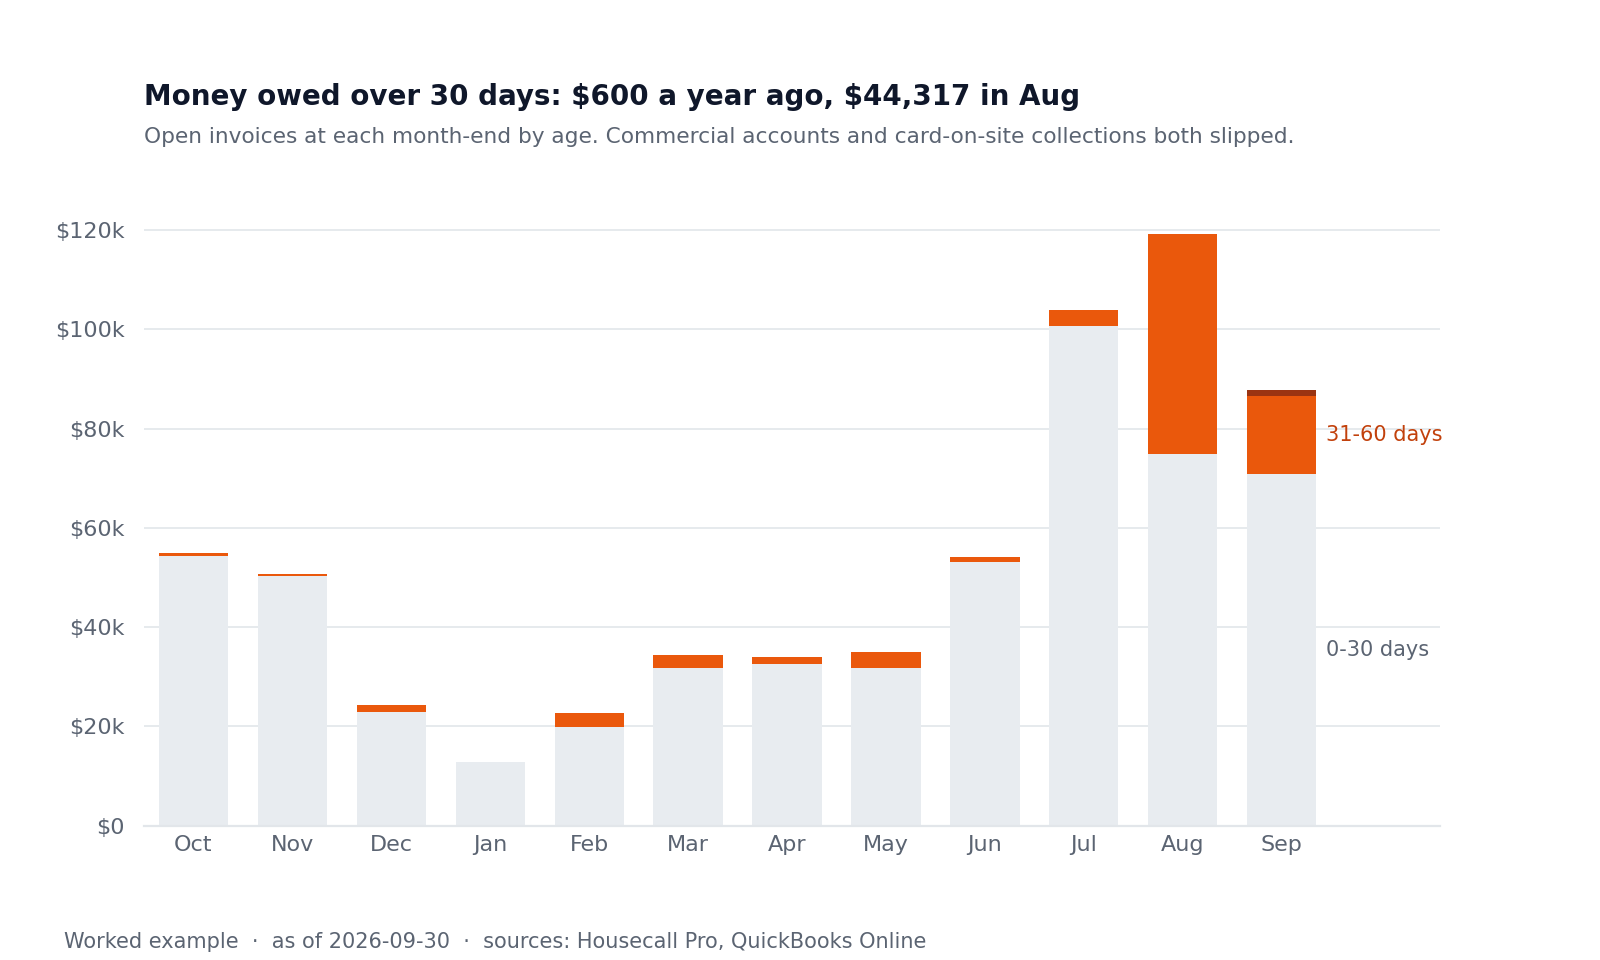
Owed over 30 days: $600 a year ago, $44,317 in August, $16,837 in September. Collected, it adds 0.7 weeks of cash cover.
“We had our best summer ever and I have less money in the bank than last year. Where is it going?”
What I worked from
Four exports the owner already had: Housecall Pro jobs (4,677 over 24 months, 3,160 won) and leads (4,402), the QuickBooks Online profit and loss by month, and the bank balance on 30 September. I reconciled them to each other first: invoices sum to revenue, expense categories to their totals, materials in QuickBooks to materials on the jobs.
Findings
$486,858
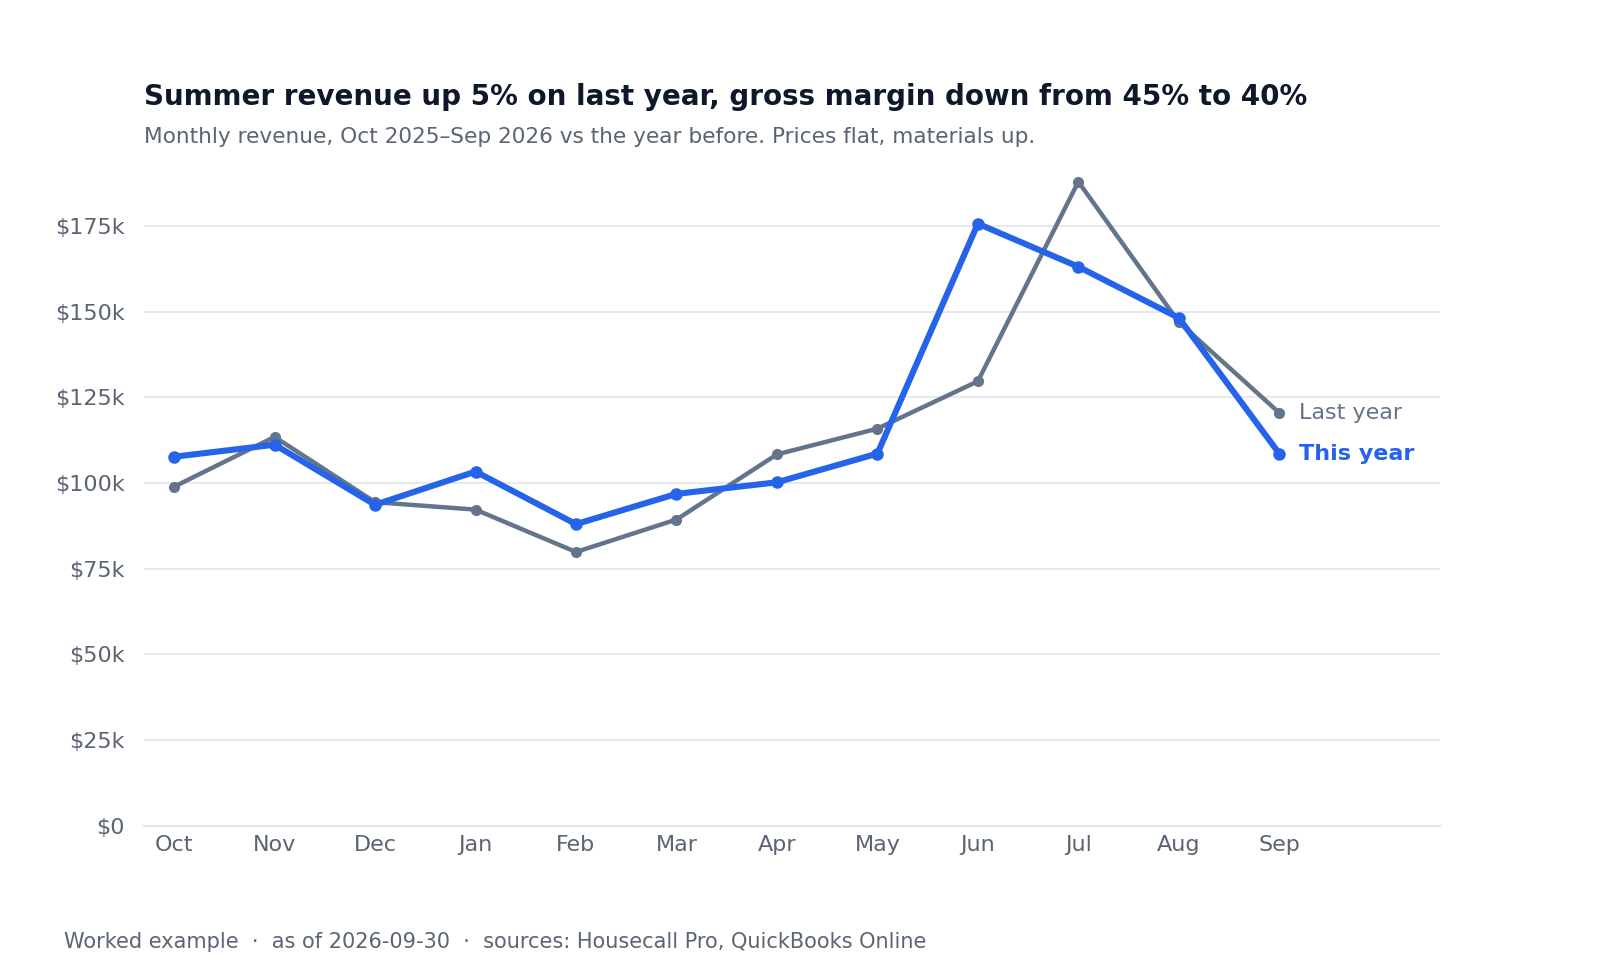
June to August revenue, up from $464,455
The summer was bigger but less profitable. Gross profit fell from $208,226 to $194,261. Materials went from 41.8% to 46.9% of revenue while the average AC repair moved only from $666 to $681.
$2,403
gross profit from 611 maintenance visits
Maintenance visits make nothing; plan members make the business. 611 of 1,588 jobs were plan visits at $114. Plan members, 38.0% of customers, produced $144,166 of repair profit, 49.6% of all of it.
32%
over quoted hours on one technician’s installs
T4’s 36 installs took 783 hours against 594 quoted. The other five technicians are within 3%.
26.9%
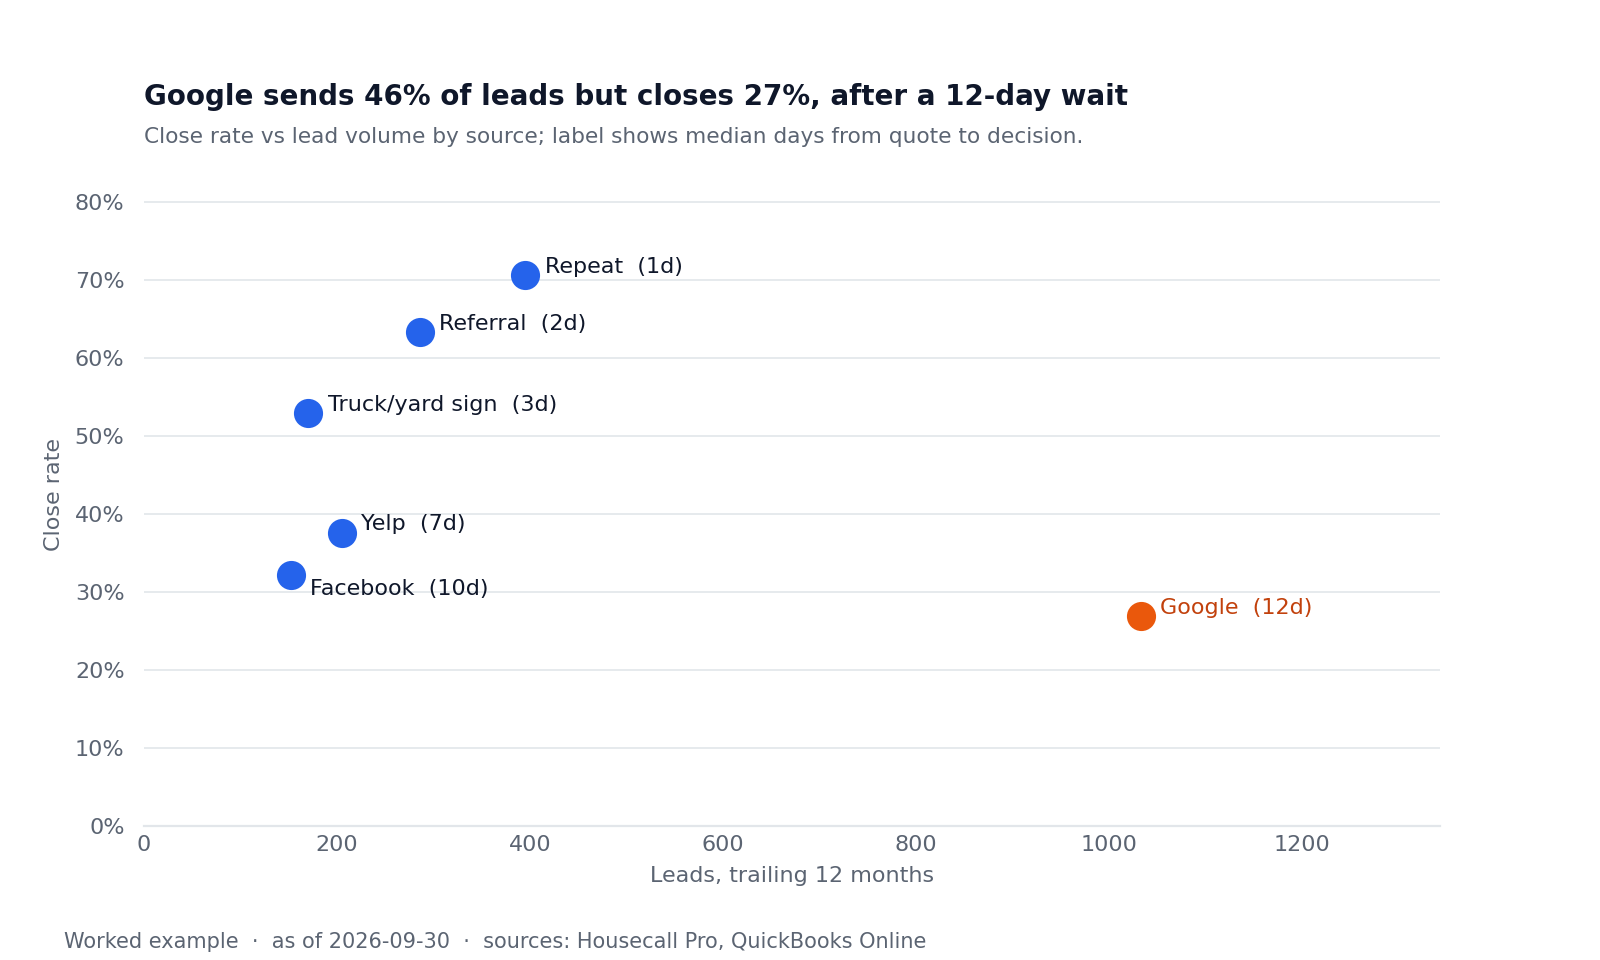
close rate on Google leads
Google sends the most leads and closes the fewest: 1,033 of 2,241 leads, a 12-day median wait from quote to decision, $104 of ad spend per won job. Referrals close at 63.3% in 2 days for $20.
$16,837
owed more than 30 days at the end of September
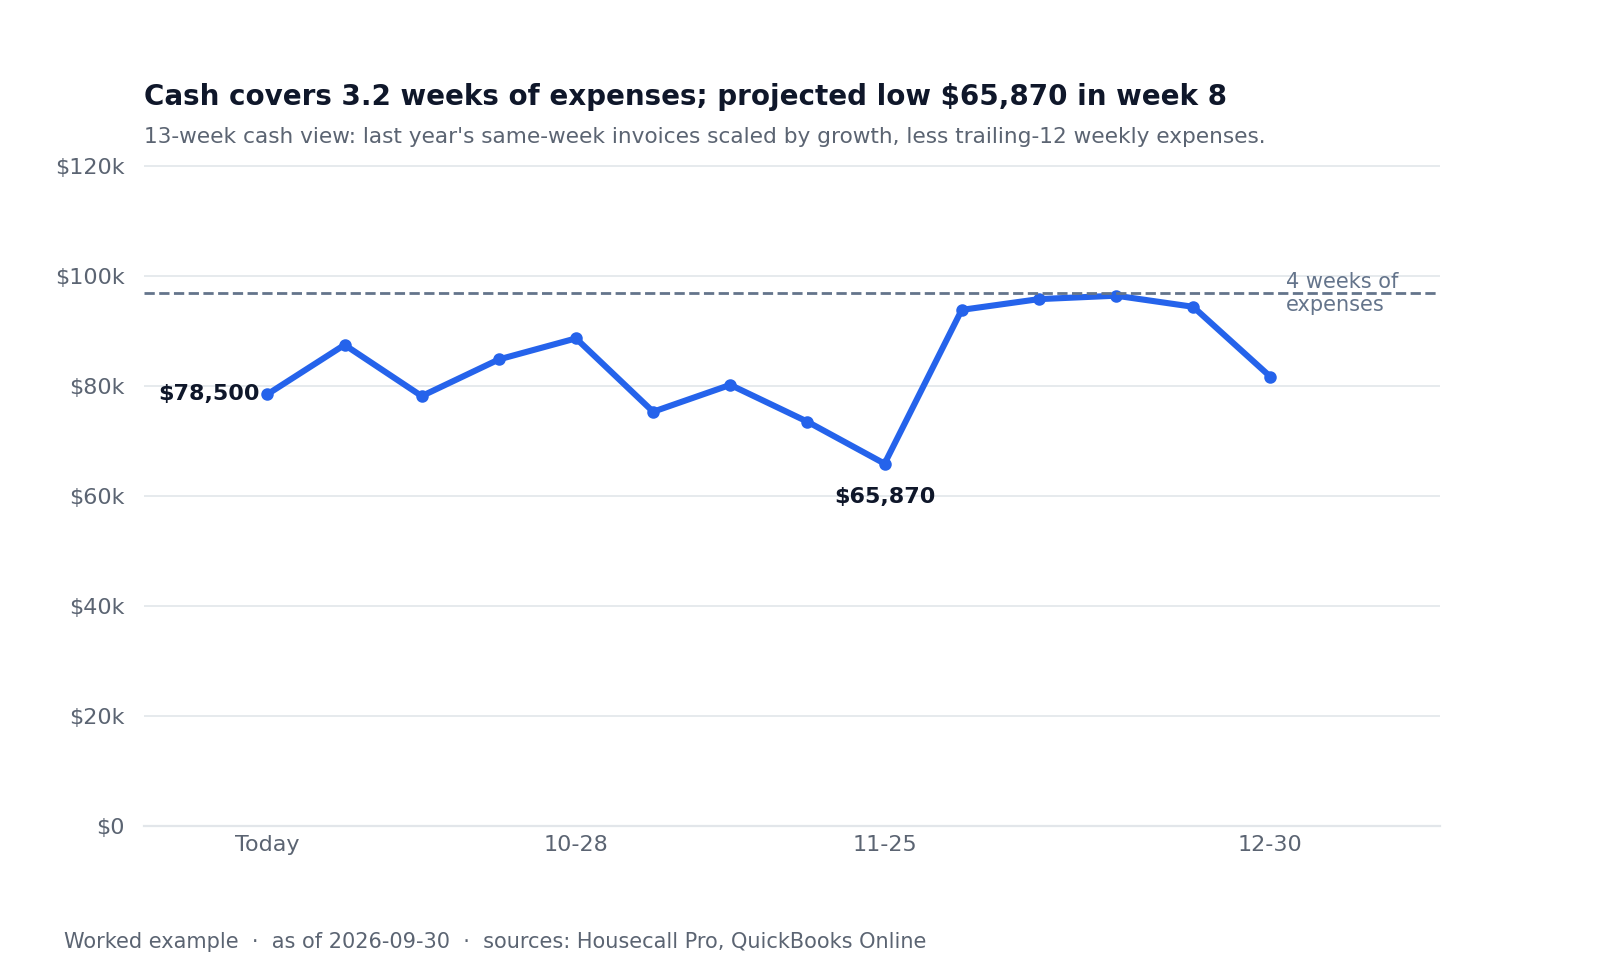
Money owed jumped in the last quarter. Invoices over 30 days: $600 a year ago, $44,317 at the end of August, $16,837 at the end of September. The $78,500 in the bank covers 3.2 weeks of expenses.
Also recommended
Put a 48-hour follow-up on every Google quote and measure for a quarter before touching the ad budget.
Expected effect: Each point of close rate is about 10 jobs at $1,537.
Caveats
Gross profit is revenue less materials and labor at the owner’s $42 loaded rate: management information, not the accountant’s figures. The cash view is a planning aid, not a forecast. Decisions remain the owner’s.
The six charts
Read the one-page Owner's Report
Owner’s Report — September 2026
Two-truck HVAC company, Connecticut · Worked example · Prepared by Abraham Dunn · Data as of 2026-09-30 Sources: Housecall Pro jobs and leads exports, QuickBooks Online P&L by month and bank balance.
Verdict: WATCH — revenue is holding, margin and collections are slipping.
| Sep 2026 | Aug 2026 | Sep 2025 | Trailing 12 months | |
|---|---|---|---|---|
| Revenue | $108,560 | $148,148 | $120,447 | $1,404,583 |
| Gross profit | $38,816 | $59,773 | $47,917 | $544,556 |
| Gross margin | 35.8% | 40.3% | 39.8% | 38.8% |
| Net profit | $5,448 | $23,375 | $18,349 | $145,336 |
| Jobs completed | 148 | 122 | 155 | 1,588 |
| Close rate | 34.8% | 41.1% | 52.4% | 42.6% |
| Money owed to you | $87,735 | $119,155 | $34,932 | $52,760 (12-month average) |
| Owed more than 30 days | $16,837 | $44,317 | $600 | $6,450 (12-month average) |
What happened
September was a quiet month. Revenue of $108,560 came in below last September’s $120,447, and gross margin fell to 35.8%. The bigger story is the summer. June to August brought in $486,858 against $464,455 a year ago, yet gross profit fell from $208,226 to $194,261: materials rose from 41.8% to 46.9% of revenue while prices barely moved (average AC repair $681 this summer, $666 last). Two things pull the margin down further. Maintenance plan visits were 611 of this year’s 1,588 jobs and earned $2,403 of gross profit, but plan members produced $144,166 of repair profit, 49.6% of the repair total, so the plan is your front door, not your problem. And T4’s 36 installs took 783 hours against 594 quoted; every other technician is within 3%. The item to watch is money owed: $87,735 open at month-end, $16,837 of it over 30 days, against $600 a year ago. With $78,500 in the bank, 3.2 weeks of expenses, the 13-week view bottoms at $65,870 in the week ending 2026-11-25.
Actions
- Walk T4’s install quotes against the clock this month. 783 actual hours against 594 quoted is 189 hours over, which at your $42 loaded hourly cost is $7,938 of labor a year, plus the installs that crew could have done with the time back. Expected effect: up to $7,938 a year in labor cost, before any extra install capacity.
- Call every invoice over 30 days this week, and put commercial accounts on a deposit plus net-15. Collecting the $16,837 now over 30 days takes the bank balance to $95,337 and adds 0.7 weeks of cover (weekly expenses are $24,216). Expected effect: $16,837 of cash in the next 30 days.
- Reprice the maintenance plan. Each visit bills $114 and earns $4 of gross profit on average. At $149 a visit, this year’s 611 visits would have earned $21,385 more, lifting plan-visit gross profit from $2,403 to $23,788 without touching the repair work members bring. Expected effect: $21,385 a year at current visit volume.
Watch list
- Google leads. 1,033 of 2,241 leads this year, the most of any source, but a 26.9% close rate and a 12-day median wait from quote to decision; $104 of ad spend per won job against $20 for referrals. A 48-hour follow-up on Google quotes is the cheapest test; each 1-point rise in close rate is about 10 jobs at $1,537 average.
- Materials share of revenue. 46.9% this summer against 41.8% last summer; the price list has not moved with supplier costs.
- Close rate. 34.8% in September against 42.6% for the year.
- Cash. Projected low of $65,870 in week 8 of the 13-week view; the 4-week line ($96,865) is not reached until mid-December.
- Customer concentration. Top 10 customers are 11.0% of revenue across 598 customers: no concentration risk, nothing to act on.
Worked example. Management information, not audited financial statements. Decisions remain the owner’s.
See services or email Abe at abe@abrahamdunn.com